Market Report: Trying to break out
Jun 2, 2017·Alasdair MacleodApart from some minor profit-taking over the last two days of this week (into early European trade this morning – Friday) the undertone in precious metals has been remarkably positive. 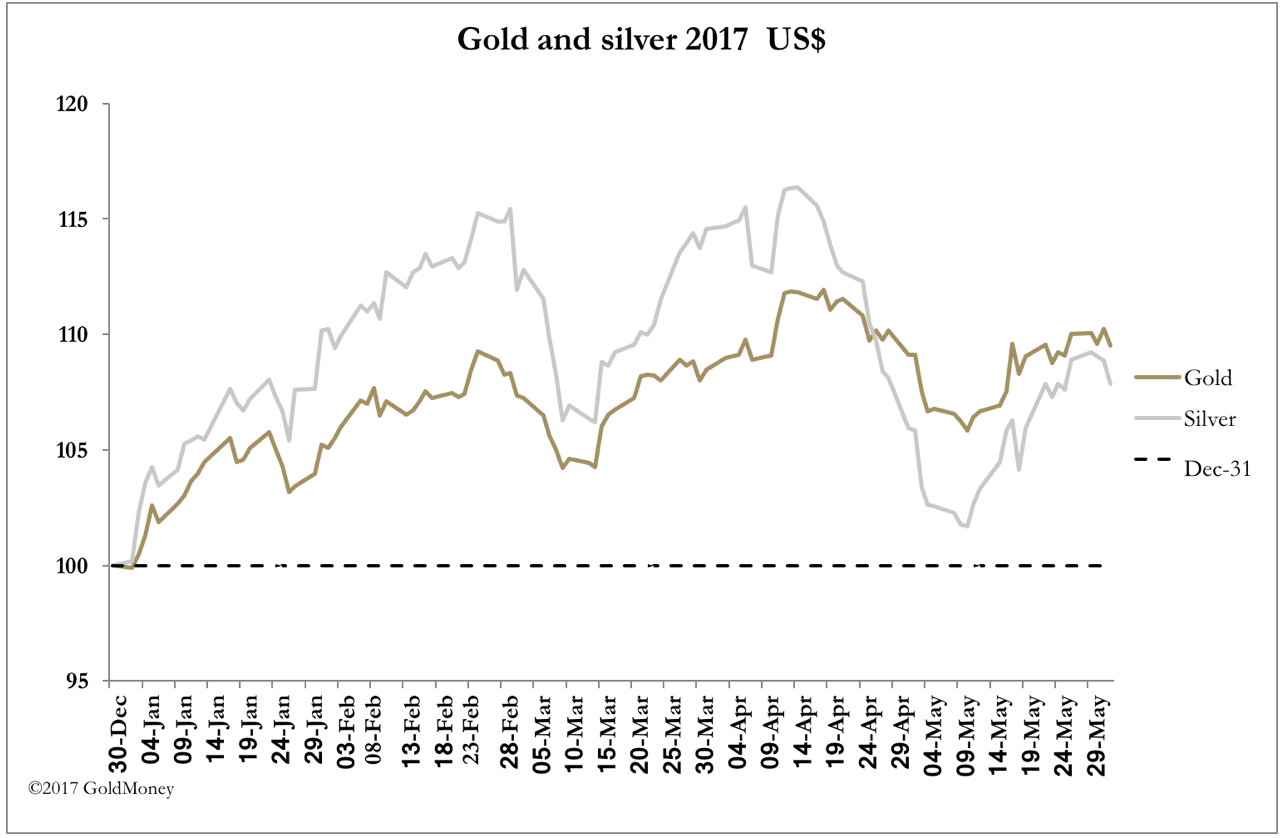
The strength appears to be emanating from the US, given the trading pattern is caution in the European time zone, followed by firmer markets in the US. This is therefore Comex driven, and there is plenty of action to report, given markets were shut on Monday for a public holiday, which failed to dent turnover earlier in the week.
At the time of writing (03.00 EST, 0700GMT) gold was down $6 from last Friday’s close at $1261, and silver down 17 cents at $17.18. The next chart puts the current consolidation, which is 12 trading sessions old, into a technical perspective.
Gold’s consolidation is just above the moving averages commonly followed, and which chartists use to define bull and bear markets. From breaking down in bearish formation in early May to find support at $1220, gold appears to have reversed its trend, and now sits on the cusp of a bullish pattern. The price is above both averages, and the 55-day MA has crossed the 200-day MA in bullish formation. The only spoiler is the 200-day MA is still declining gently, and for a true “golden cross” it should be turning upwards as well.
This reversal of events is accompanied with an even more bullish indicator, which marked a major bottom for us before. The economic commentator Harry Dent came out with an extremely bearish forecast, talking gold down to $700, just before the price took off last December. He hit the market bottom with impressive precision. Harry is at it again, and on this basis as a contrary indicator gold is timed to move significantly higher.
Joking aside, we need to look at Comex in more detail, which is where the action is taking place. First, a look at gold’s open interest in our third chart.
Note how open interest has lagged the gold price since the start of this year. This is a far cry from the bullish days when open interest hit 650,000 contracts. Given that on a net basis the trading bears are the bullion banks and the trading bulls are hedge funds, we see a rising gold price in a market that still looks oversold-to-neutral on a long-term basis.
For confirmation, the next chart shows the hedge funds (managed money) net position as reported in the Commitment of Traders report.
Since the gold price bottomed in December 2015, we see that bullishness is very subdued. The long-term average net longs since 2006 (when COT Reports were first released in this format) is 112,000 contracts. The most recent recorded was 111,048, right on the money.
We can conclude that it is not bullishness on Comex that’s driving the gold price. The last two charts tell us the consensus view on Comex is neutral, yet the gold price has clearly been in a rising trend since December 2015, when gold found a bottom at $1050. A rising price looks more like a bear squeeze on the bullion banks, rather than hedge fund bullishness.
A last thought. China is pushing her currency higher, making physical bullion cheaper for her citizens, who are value buyers. No wonder the market shows all the signs of tightening.
The views and opinions expressed in this article are those of the author(s) and do not reflect those of Goldmoney, unless expressly stated. The article is for general information purposes only and does not constitute either Goldmoney or the author(s) providing you with legal, financial, tax, investment, or accounting advice. You should not act or rely on any information contained in the article without first seeking independent professional advice. Care has been taken to ensure that the information in the article is reliable; however, Goldmoney does not represent that it is accurate, complete, up-to-date and/or to be taken as an indication of future results and it should not be relied upon as such. Goldmoney will not be held responsible for any claim, loss, damage, or inconvenience caused as a result of any information or opinion contained in this article and any action taken as a result of the opinions and information contained in this article is at your own risk.