Canadian Dollar to USD: Oil, Stock and Flow
May 5, 2017·Goldmoney StaffIn this report, we look at Canadian dollar movements through the lenses of our real-interest rate, long-dated energy price framework for currency. Just as we found in our gold price model, we find that the CADUSD has a stronger relationship with long-dated oil prices than spot oil prices, and that the movements of long-dated oil form a closer link to the CADUSD cross than traditional currency drivers. While more work needs to be done on our empirical framework for pure currency to currency crosses, our initial takeaway is that the Canadian dollar is perhaps less vulnerable to further weakness than implied by market positioning – absent a broader dislocation in financial markets, of course.
View the entire Research Piece as a PDF here.
DOES SENTIMENT MOVE CURRENCY MARKETS?
Market sentiment towards the Canadian dollar became increasingly bearish in the past week, as reflected in the most recent CFTC Commitment of Traders report. Among the major currencies, the loonie experienced the largest increase in week-over-week open interest, the largest increase in net short positions, and now holds the number two spot in both net short position and total short position outstanding after the Brexit-plagued British pound.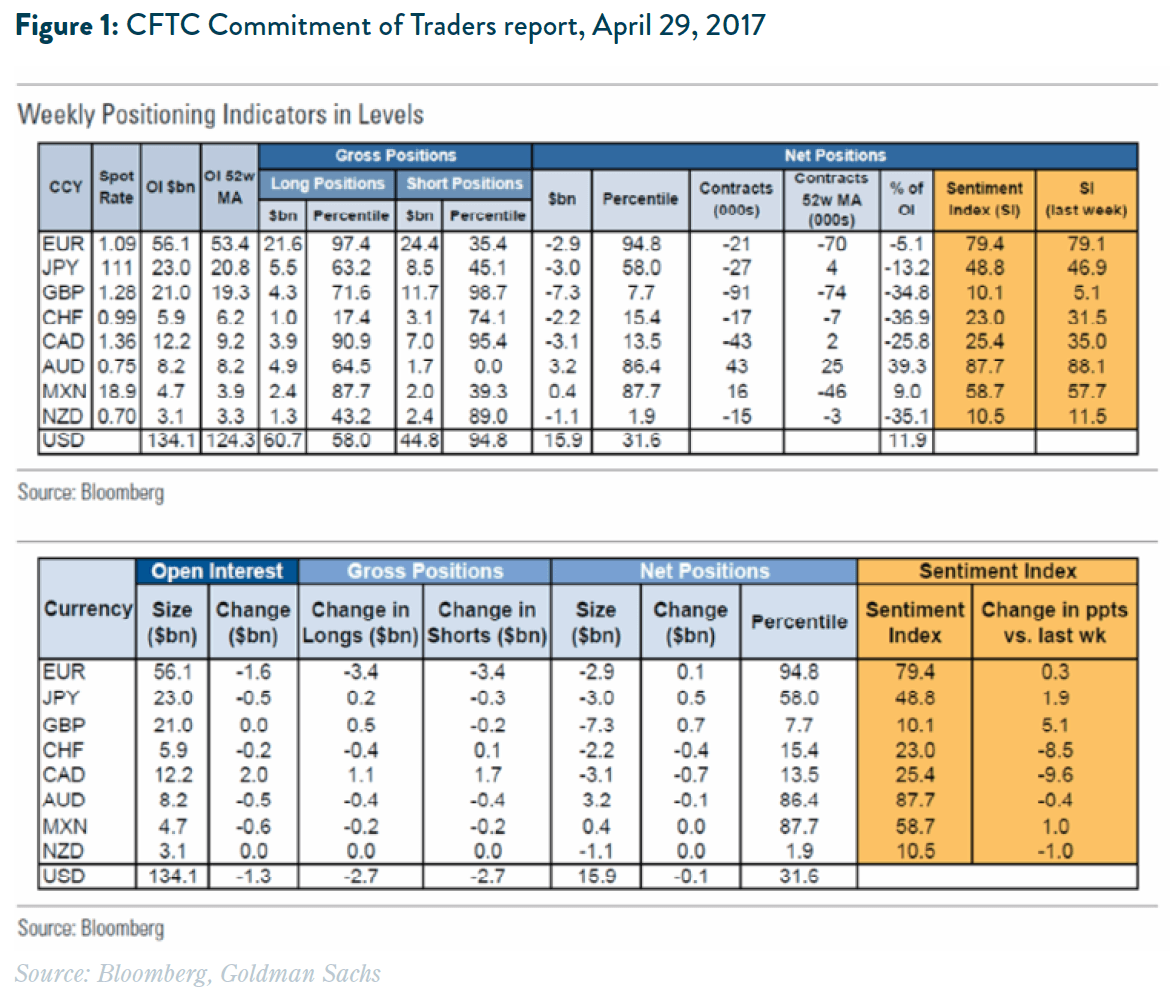
There are a variety of reported factors behind this increase in bearish sentiment and positioning, from mortgage and housing market fears building over Home Capital to the Trump administration’s renewed war on Canadian soft lumber and dairy farmers.
However, in markets as large and liquid as global currency, these headline-grabbing sentiments seldom lead to significant changes in prices or volatility. As well known to gold investors and followers of our market research, the sensationalized sentiment of gold and currency markets rarely creates a lasting deviation from real-interest rate and energy market fundamentals. While we’ve spent much time debunking the (neverending) headline myths that ‘gold bug’ fear and sentiment drive gold prices, we now turn to the Canadian dollar for signs of deviation from fundamentals.
As shown later in our analysis, we do not see significant CAD deviation from structural drivers; however, we should outline what we believe the fundamental drivers of the Canadian dollar are that lead us to reach that conclusion.
FOREX FUNDAMENTAL ANALYSIS AND THE CANADIAN DOLLAR TO USD
Without diving into full treatises on the fundamentals of floating fiat exchange rates (where no academic or market consensuses has been reached on what truly drives relative currency valuations), we will simply highlight the typical factors that determine the relative strength between two debt-based currencies. First and foremost is interest rate differentials, where the movements in a currency pair should typically reflect the carry trade arbitrage of borrowing in one currency at a given interest rate, then exchanging and lending out in the other. All other things being equal, the exchange rate should follow the path of the movements of the two currencies’ relative interest rate environments. However, underlying this differential are the actual economic conditions that determine the rate environments to begin with: relative growth, inflation, unemployment, trade, and government fiscal balances.
For the Canadian dollar and Canadian economy, many of these underlying factors often remain tied to the U.S. economy given the significant trade and investment links between the two neighbors. Canadian exports are typically strong when U.S. growth is strong, and both economies can experience a rising rate environment; the difference is mostly determined by the effects of inflation on the growth and rate paths. This leads us to look at real-interest rate differentials as well as nominal differentials.
In our view, real-interest rate expectations should have an even larger impact on exchange rates than nominal yields, as real-interest rate differentials contain information about future interest rates as well as inflation expectations of the respective currencies. For example, we showed in our recent note “Why the Japanese yen mirrors gold's performance, 1 May 2017” that the JPY/USD exchange rate has broadly followed the real-interest rate differentials between the dollar and the yen over a prolonged period; however, when looking at the Canadian dollar, there seems to be more going on than just rates, as Canadian rates have tracked U.S. rates fairly closely over time (see Figures 2 and 3).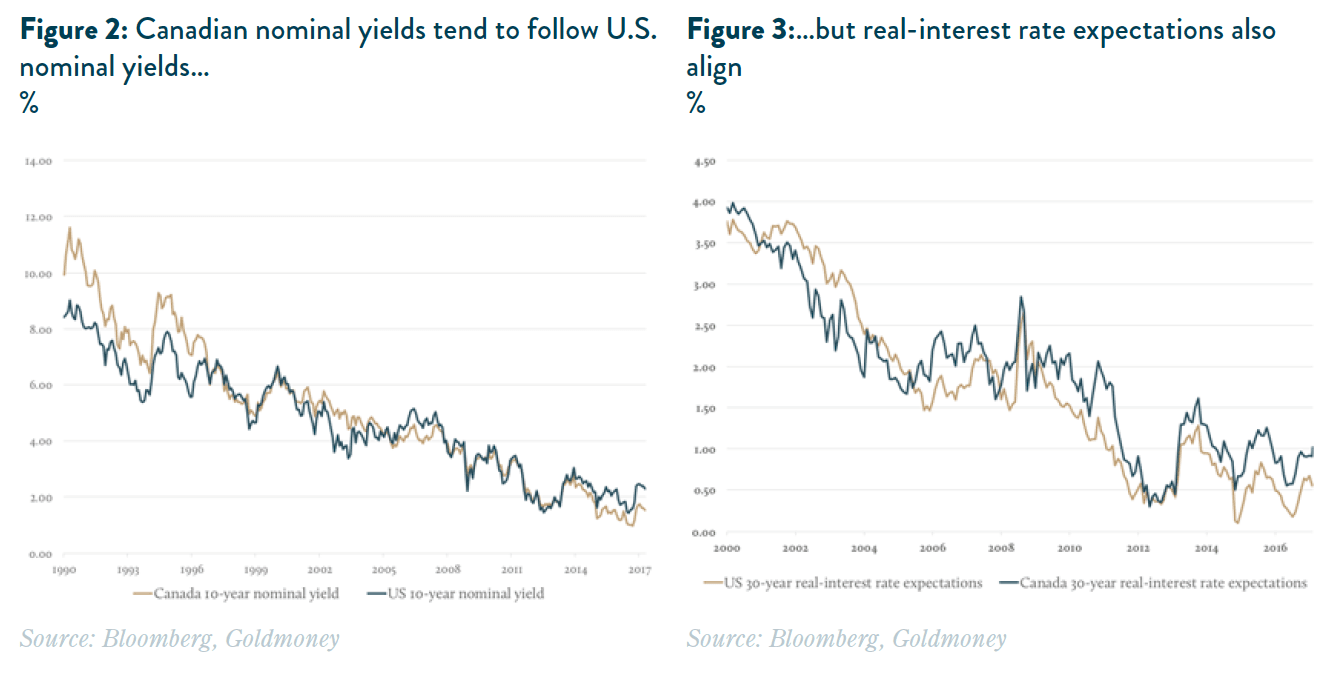
IF RATES HAVE BEEN SIMILARLY ALIGNED OVER TIME, WHY THE 30-40% SWINGS BETWEEN USD & CAD?
Where the fundamentals of the two G10 neighbors significantly differ of course, is the fact that Canada is a large next exporter of energy and commodities, running lower trade deficits and drawing in foreign investment in times of high commodity prices, while the opposite has been true for the U.S. economy for much of the past five decades. In our empirical framework for valuing money and currencies (viewing money as “proof of time and energy”), this becomes a very important differentiator, where the value of the currency rises and falls on the changing stock and flow of capital and energy underlying the economy.
While both U.S. and Canadian central banks may follow similar rate paths when it comes to growth and inflation (“flow” pricing on rates and money), the inflationary effects from rising commodity prices significantly change the “stock” effects of the debt and assets underlying each currency respectively. To put it differently, the value of the “collateral” backing the money stock in the Canadian economy is stronger when commodity prices are high, and likely drawing expectations of lower deficits and less sovereign debt stock moving forward, so the value of the currency rises. So, the nominal price of money and debt may look similar in terms of “flow” pricing in rates, but very different when it comes to the value of the “stock” under different commodity price expectations environments.
OIL PRICES, STOCK, AND FLOW
To test this thesis, we look at the relative importance of oil prices to the CADUSD exchange rate; however, when analyzing the impact of oil prices, it is important to highlight that there is no such thing as “the oil price”. First, there are numerous grades of oil, all of which can vary substantially in price. Location is also an important factor: A barrel sitting in storage at a Canadian oil sand producer is worth considerably less than the same barrel in Houston, Texas. But beyond quality and location, oil is priced differently for different delivery dates. There is the spot price of oil, which is the price a buyer pays to a seller for immediate delivery. Spot prices are not widely reported. The benchmark oil price usually reported by the media is in fact a futures price. It’s typically the price of the contract closest to expiry, which is known as the front month contract, but oil can be traded with delivery out several years. The prices of the individual contracts form the so-called forward curve. When the curve is flat, both near-dated and long-dated future prices are roughly equal. In a backwardated curve, longer-dated prices are lower than near-dated price. The opposite is called Contagno. Longer-dated prices should reflect the marginal cost of future supply – that is the price needed by oil producers to sanction the marginal project required to ensure that future supply can meet future demand. Prices at the front end have little to do with costs; they simply reflect the inventory situation. We covered this extensively in our report “Something’s got to give in the oil market, 3 May 2016”.
So which oil price should be studied in order to determine its impact on the Canadian dollar? In terms of quality, Canada exports a mix of crude, but increasingly exports heavy sour crude. Unfortunately, the price of heavy sour crude is harder to come by than the typical light sweet benchmark such as WTI in the U.S. and Brent in Europe. Bloomberg reports prices for Cold Lake at Hardisty, but data goes only back about 10 years.
The second, and in our view more important aspect, is whether to use the spot or longer-dated future price. In our framework, we found that longer-dated oil prices are a more important driver for gold prices than spot or near-dated prices. The reason is that spot prices – driven by changes in oil inventories – may affect short-term profitability of gold producers, but they don’t set the costs for future gold supply. In our view, the same argument holds for the CAD. Short-term swing in spot prices (and with changing product premiums) may impact current demand and supply for U.S. dollars vs. Canadian dollars, but over the long run, the longer-dated prices anchor the value of energy and commodity infrastructure; while they also reflect the forward expectations for the Canadian economy – and thus the CAD.
Unfortunately, longer-dated oil prices are much less liquid than spot prices and therev is no publicly available data for forward prices for Canadian heavy sour crude. The closest match would be five-year forward WTI prices. In Figures 4 and 5 we overlaid the CAD with both the front month WTI price and the five-year forward price. Despite the significantly decreased liquidity in longer-dated contracts since the financial crisis, the CAD follows longer-dated oil prices much better than the spot prices. This is in line with our expectations that the currency – although it can partially reflect current exchange flows – should be looking through short-term inventory constraints (“flows”) and price in longer-dated energy prices and “stock” values in the economy.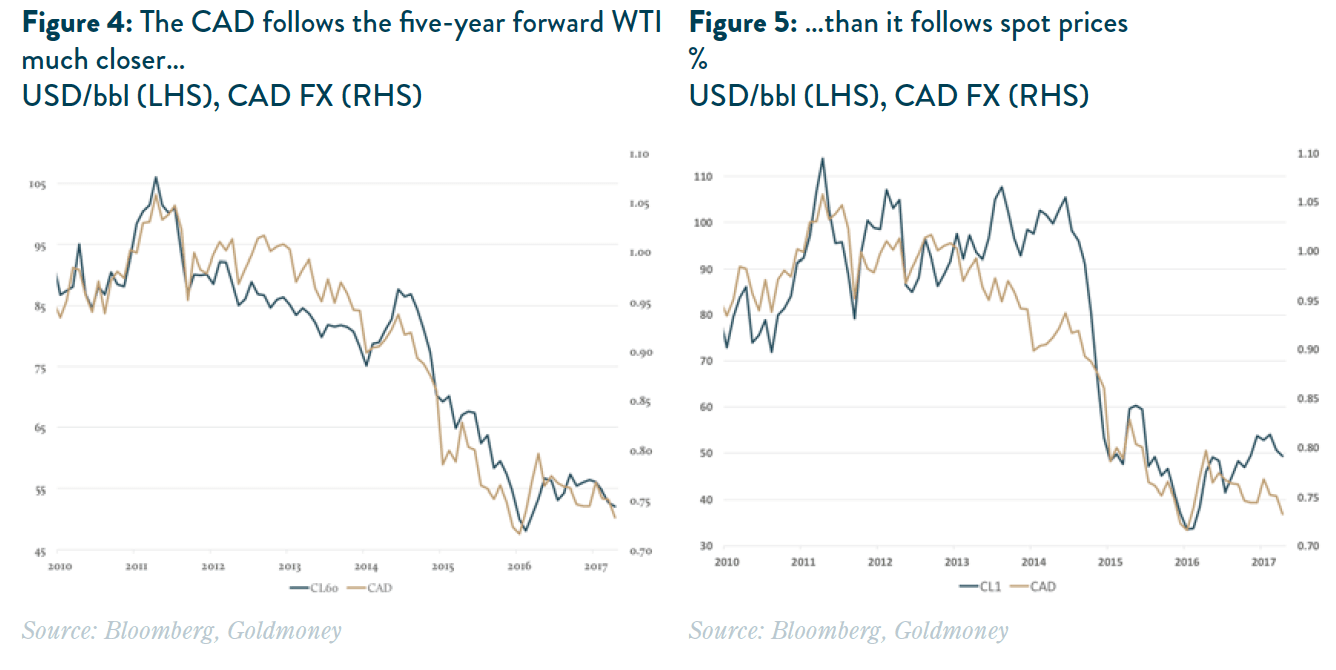
THE LONG-DATED THESIS LINES UP – SO HOW DOES IT MODEL?
To determine the true drivers of the Canadian dollar, we run a multiple regression analysis over a prolonged period. Unfortunately, WTI price data on Bloomberg only goes back about 10 years before it becomes spotty. We therefore use five-year forward Brent data instead. While we have a longer data set for five-year forward Brent, we are aware that the data quality is not great given the very thin liquidity. We also run into data problems for Canadian real-interest rate expectations, where data for 10-year yields only goes back a few years; 30-year yield data only goes back to 2000, so we use the 10-year nominal differential in our analysis instead.
The last variable we use is the size of quantitative easing (QE) deployed by the Fed (we highlighted the rationale for these essentially dummy variables in our Gold price framework report). QE impacts real-interest rates (driving real-interest rate expectations down) but the impact of QE on gold, for example, exceeded the impact it had on real-interest rate expectations given the shift in expectations around total money stock. In other words, the announcement of the first round of QE had a significant impact on U.S. real-interest rate expectations, which in turn pushed gold prices higher in USD, but gold prices rose more than what the move lower in real-interest rates would have warranted and it stayed there. Hence, we concluded that QE led to a step shift higher in gold prices.
CONCLUSIONS
Despite all the data issues we ran into, we get a surprisingly good fit for our model (see Figure 6). The r-square adjusted is well over 80%. Both five-year forward Brent prices and nominal interest rate differentials are highly significant. Replacing five-year forward Brent rates with WTI front month prices reduces the r-square adjusted by 2% and leads to a slightly lower t-stat for the oil coefficient.
While this is just an early pass of modeling our framework (we will dive deeper into currency to currency fundamentals in volume V of our currency price framework series), we do find that the current Canadian dollar exchange rate remains in line with long-dated energy prices and the broader model predictions as well.
The views and opinions expressed in this article are those of the author(s) and do not reflect those of Goldmoney, unless expressly stated. The article is for general information purposes only and does not constitute either Goldmoney or the author(s) providing you with legal, financial, tax, investment, or accounting advice. You should not act or rely on any information contained in the article without first seeking independent professional advice. Care has been taken to ensure that the information in the article is reliable; however, Goldmoney does not represent that it is accurate, complete, up-to-date and/or to be taken as an indication of future results and it should not be relied upon as such. Goldmoney will not be held responsible for any claim, loss, damage, or inconvenience caused as a result of any information or opinion contained in this article and any action taken as a result of the opinions and information contained in this article is at your own risk.